Archive for 2015

The Cause of Spurious Mouse Move Messages/Events when task manager is open

Recently while programming in JavaScript I noticed that my mousemove event keeps firing without my mouse moving, as long as my mouse is over the relevant object. It seemed strange so I searched for this behavior online and apparently quite a few others encountered it and thought it was strange: [1] http://stackoverflow.com/questions/17818493/mousemove-event-repeating-every-second, [2], [3], [4].

The specification says “A user agent must dispatch this event when a pointing device is moved while it is over an element (emphasis is mine), confirming that this behavior isn’t originated in the standard. Luckily for me, the first link from above helped me find the source of this behavior: the Task Manager was open in the background.

At the OS level

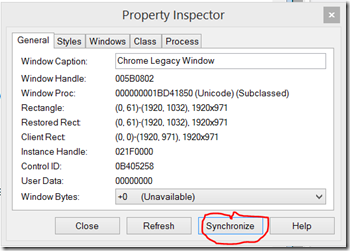
First I wanted to check what’s happening at the OS level, Applications mostly handle input by listening to Windows Messages and a tool for observing them is Spy++. Because my version of Chrome is 32-bit, I opened the 32-bit version of Spy++ (spyxx.exe rather than spyxx_amd64.exe). After locating Chrome’s window using the crosshair from the Search –> Find Window dialog we get information about the window:
image 
Clicking Synchronize will highlight the window on the main windows tree. By right clicking the window entry in the tree and clicking Messages we can capture windows messages targeted at this window:
image 
When holding the mouse over the browser window without moving it the following messages keep repeating:
 image
One of the repeating messages is WM_MOUSEMOVE which not surprisingly represents mouse movement, and apparently Chrome doesn’t check whether the mouse has actually moved and passes the event to the web application. Actually Firefox and IE11 behave differently in this case (the mousemove event doesn’t keep firing), probably because they do check whether the mouse has moved each time.

That showed that the underlying issue is the continuing arrival of WM_MOUSEMOVE messages, and not a web specific issue.

Why does it happen?

I wondered why would a background application (Task Manager) affect in such a way other applications (Although this shouldn’t cause bugs because mouse move handling is usually idempotent), so I wanted to debug this issue.

The assumption is that there’s a piece of code in Task Manager that causes it and the goal is finding it. Since Task Manager is a Win32 GUI application much of its code is powered by Windows Messages, and our code of interest is likely run in response to a Windows Message.

Since the WM_MOUSEMOVE messages seem to be arriving approximately every 1 second, we can look for similar periodical windows messages with Spy++ (This time with the 64-bit version), After Similarly locating the Task Manager main window we can capture messages targeted at this window:image

To our expectation, there’s a user defined Windows Message arriving every 1 second, so we can debug its handling code and likely find the root cause. After attaching WinDBG we can switch context to the message pumping thread (with ~0s) and look at the call stack:

0:000> k
Child-SP RetAddr Call Site
000000eb`dad2f618 00007ffc`2b4013ed ntdll!NtWaitForMultipleObjects+0xa
000000eb`dad2f620 00007ffc`2ded3100 KERNELBASE!WaitForMultipleObjectsEx+0xe1
000000eb`dad2f900 00007ffc`265311ca USER32!RealMsgWaitForMultipleObjectsEx+0x100
000000eb`dad2f9b0 00007ffc`2653134b DUser!CoreSC::xwProcessNL+0x2d6
000000eb`dad2fa40 00007ffc`2ded2822 DUser!MphProcessMessage+0xb3
000000eb`dad2faa0 00007ffc`2e213034 USER32!_ClientGetMessageMPH+0x52
000000eb`dad2fb30 00007ffc`2ded26ca ntdll!KiUserCallbackDispatcherContinue
000000eb`dad2fba8 00007ffc`2ded2695 USER32!NtUserGetMessage+0xa
000000eb`dad2fbb0 00007ff6`ba4d6d6a USER32!GetMessageW+0x25
000000eb`dad2fbe0 00007ff6`ba4e2144 Taskmgr!wWinMain+0x2aa
000000eb`dad2fcc0 00007ffc`2b8113d2 Taskmgr!__wmainCRTStartup+0x1d4
000000eb`dad2fd90 00007ffc`2e195444 KERNEL32!BaseThreadInitThunk+0x22
000000eb`dad2fdc0 00000000`00000000 ntdll!RtlUserThreadStart+0x34

The interesting frame is highlighted above, that’s the message loop frame and there we can start debugging the message handling code. First we can disassemble around it to see where is the current message stored:


0:000> u Taskmgr!wWinMain+0x270 l30
Taskmgr!wWinMain+0x270:
00007ff6`ba4d6d30 488b0dc1d60700 mov rcx,qword ptr [Taskmgr!g_MainWindow (00007ff6`ba5543f8)]
00007ff6`ba4d6d37 4c8d4510 lea r8,[rbp+10h]
00007ff6`ba4d6d3b 488bd3 mov rdx,rbx
00007ff6`ba4d6d3e ff1544c30800 call qword ptr [Taskmgr!_imp_TranslateAcceleratorW (00007ff6`ba563088)]
00007ff6`ba4d6d44 488d4d10 lea rcx,[rbp+10h]
00007ff6`ba4d6d48 ff15eac20800 call qword ptr [Taskmgr!_imp_TranslateMessage (00007ff6`ba563038)]
00007ff6`ba4d6d4e 488d4d10 lea rcx,[rbp+10h]
00007ff6`ba4d6d52 ff15e8c20800 call qword ptr [Taskmgr!_imp_DispatchMessageW (00007ff6`ba563040)]
00007ff6`ba4d6d58 488d4d10 lea rcx,[rbp+10h]
00007ff6`ba4d6d5c 4533c9 xor r9d,r9d
00007ff6`ba4d6d5f 4533c0 xor r8d,r8d
00007ff6`ba4d6d62 33d2 xor edx,edx
00007ff6`ba4d6d64 ff1516c30800 call qword ptr [Taskmgr!_imp_GetMessageW (00007ff6`ba563080)]
00007ff6`ba4d6d6a 85c0 test eax,eax

The first parameter to GetMessage is the message (passed in the rcx register), so It’s stored at [rbp+10]. Now we can add a conditional breakpoint for the user defined message with bp Taskmgr!wWinMain+0x2aa "j poi(@rbp+18)=4df '';'gc'"  (rbp+18 is used because the message number is the second parameter of the MSG structure, 4df is the user defined message code from the above Spy++ output).


After we run the app and the breakpoint fires it’s just a matter of tracing until finding the code of interest. A good method for that kind of search is jumping over function calls and seeing how the application reacts, until we jump over the function that causes the suspicious behavior to disappear (sort of binary search). To save time, I’ll skip the search process and show that function, it’s a call to SendMessage at Taskmgr!WdcDataMonitor::ListUpdate+0x45f:

0:000>  u Taskmgr!WdcDataMonitor::ListUpdate+0x45f
Taskmgr!WdcDataMonitor::ListUpdate+0x45f:
00007ff6`ba505d0f ff1583d10500 call qword ptr [Taskmgr!_imp_SendMessageW (00007ff6`ba562e98)]
00007ff6`ba505d15 418bc4 mov eax,r12d
00007ff6`ba505d18 488b8d90010000 mov rcx,qword ptr [rbp+190h]
00007ff6`ba505d1f 4833cc xor rcx,rsp
00007ff6`ba505d22 e8f9c4fdff call Taskmgr!_security_check_cookie (00007ff6`ba4e2220)
00007ff6`ba505d27 488b9c24f0020000 mov rbx,qword ptr [rsp+2F0h]
00007ff6`ba505d2f 4881c4a0020000 add rsp,2A0h
00007ff6`ba505d36 415f pop r15

The trick for constantly jumping over a function call (like a patch) is a breakpoint that changes the value of rip (the instruction pointer in x64) when it fires. In our case, because the code doesn’t check the return value we can advance it to the next instruction with that command: bp Taskmgr!WdcDataMonitor::ListUpdate+0x45f "r @rip=00007ff6`ba505d15;gc". Now after the application is run we can see that the spurious WM_MOUSEMOVE messages stop arriving.


The Windows message that is being sent – WM_SETREDRAW


The call we patched is a SendMessage call that sends a WM_SETREDRAW with the false parameter. That prevents a window from redrawing until WM_SETREDRAW is sent with the true parameter, it is targeted at the processes list view control in the Details tab and as evident by the stack trace it is sent while it’s being sorted:

0:000> k
Child-SP RetAddr Call Site
000000eb`dad2f520 00007ff6`ba508488 Taskmgr!WdcDataMonitor::ListUpdate+0x45f
000000eb`dad2f800 00007ff6`ba50643a Taskmgr!WdcProcessMonitor::ListUpdate+0x38
000000eb`dad2f840 00007ff6`ba503dba Taskmgr!WdcDataMonitor::SetSortDirty+0x5e
000000eb`dad2f880 00007ff6`ba502dc5 Taskmgr!WdcListView::Sort+0xaa
000000eb`dad2f8c0 00007ff6`ba4bbe84 Taskmgr!WdcListView::Render+0x115
000000eb`dad2f940 00007ff6`ba4f0c5c Taskmgr!WdcDataPortal::Render+0xe8
000000eb`dad2f970 00007ff6`ba4c6431 Taskmgr!WdcMonitor::Render+0x2a71c
000000eb`dad2f9c0 00007ff6`ba4c6016 Taskmgr!TmTraceControl::ForceRenderUI+0x2d
000000eb`dad2fa00 00007ffc`2ded250d Taskmgr!TmWindowProc+0xf6
000000eb`dad2fa90 00007ffc`2ded2367 USER32!UserCallWinProcCheckWow+0x149
000000eb`dad2fb60 00007ff6`ba4d6d58 USER32!DispatchMessageWorker+0x1a7
000000eb`dad2fbe0 00007ff6`ba4e2144 Taskmgr!wWinMain+0x298

That message is used to prevent numerous window redraws while many updates are being made to it (sorting could surely cause many updates). The issue is how it is implemented by default, and that’s by making the window invisible, which along with the WM_SETREDRAW with the true parameter that is being sent later, causes Windows to send WM_MOUSEMOVE messages, and the puzzle is complete.


In conclusion, as I wrote above, I don’t think this behavior is very problematic, as the extra messages shouldn’t usually change application’s behavior, and if they do, the application should be fixed anyway because Windows doesn’t guarantee sending them on actual mouse movement (the above linked post explains why), and even the web standard is somewhat ambiguous about the mousemove event.

Posted in: , by . 1 Comment

Services Console Snap-in Timeout Error message Causes

If you ever encountered a hanging service you probably saw the error: "Error 1053: The service did not respond to the start or control request in a timely fashion" when starting or stopping it from the Services console snap-in (can be quickly displayed with by running services.msc).

image

You may encounter this error when debugging service startup code and notice that after that error message your service is being terminated and the debug session is ruined. To solve this you can set the HKEY_LOCAL_MACHINE\System\CurrentControlSet\Control\ServicesPipeTimeout registry key. Having this value set you can still notice that this message appears but instead of the default 30 seconds (unlike the 2 minutes default stated in the article, at least since XP) the error message appears after 2 minutes. You may think that windows ignores values higher than 2 minutes but actually the service process isn’t terminated and this error message box appears simply because the progress dialog (pictured below) has reached its end. (Tested on Windows 8.1 and 10)

image

The fact that the displayed error code is the same in both cases, and that it corresponds to the System event log entry that happens when termination occurs (no event log entry is created when the registry key is set to a high value) were confusing to me and I wanted to verify that it actually is a UI only error and the service is not affected.

Debugging

After attaching to mmc.exe I first guessed the relevant DLL by setting a breakpoint (bp) on the user32!MessageBoxW and waited for the message box to appear, the breakpoint hit and that was the top of the stack:

0:000> k
Child-SP RetAddr Call Site
00000000`00bad578 00007ffc`7c054f59 USER32!MessageBoxW
00000000`00bad580 00007ffc`7c055039 filemgmt!DoErrMsgBoxHelper+0xa5
00000000`00bad5d0 00007ffc`7c05b86c filemgmt!DoServicesErrMsgBox+0x25
00000000`00bad620 00007ffc`7c05b1cf filemgmt!CServiceControlProgress::M_ProcessErrorCode+0x150
00000000`00badaa0 00007ffc`7c05bce7 filemgmt!CServiceControlProgress::M_EDoExecuteServiceThread+0x6f
00000000`00badae0 00007ffc`7c042282 filemgmt!CServiceControlProgress::S_EStartService+0xbb
00000000`00badb30 00007ffc`7c03a744 filemgmt!CFileMgmtComponentData::Service_FDispatchMenuCommand+0x10e
00000000`00badbb0 00007ffc`7c03e2f0 filemgmt!CFileMgmtComponent::Command+0xa4
00000000`00badc30 00007ffc`7c03df04 filemgmt!CFileMgmtComponent::OnToolbarButton+0x78
00000000`00badc60 00007ffc`7c24aacc filemgmt!CFileMgmtComponent::ControlbarNotify+0x94

filemgmt and particularly CServiceControlProgress seem relevant. Now we can guess that because the progress bar (pictured above) is most likely powered by the SetTimer API and WM_TIMER messages there is a symbol containing “Timer” in this dll:

0:000> x filemgmt!*timer*
00007ffc`7c05b5b4 filemgmt!CServiceControlProgress::M_OnTimer (<no parameter info>)
00007ffc`7c082aa8 filemgmt!_imp_KillTimer = <no type information>
00007ffc`7c0389cc filemgmt!MakeElapsedTimeResult (<no parameter info>)
00007ffc`7c082aa0 filemgmt!_imp_SetTimer = <no type information>

filemgmt!CServiceControlProgress::M_OnTimer seems easily the best canditate.


If this function didn’t contain the word “timer” and you couldn’t guess it otherwise by dumping the members of CServiceControlProgress (x filemgmt!CServiceControlProgress::*) you could still deductively find it by setting a breakpoint at the default DialogProc (user32!DefDlgProcW) then tracing to find the DialogProc of the progress bar dialog (filemgmt!CServiceControlProgress::S_DlgProcControlService), then setting a conditional breakpoint waiting for WM_TIMER messages (0x113) with bp filemgmt!CServiceControlProgress::S_DlgProcControlService ".if @rdx=113 {} .else {gc}" and then quickly tracing to the timer handler.


Fortunately, the relevant control flow is right at the start of the filemgmt!CServiceControlProgress::M_OnTimer  function (I removed some error checking code):

filemgmt!CServiceControlProgress::M_OnTimer:
00007ffc`7c05b5b4 48895c2418 mov qword ptr [rsp+18h],rbx
00007ffc`7c05b5b9 57 push rdi
00007ffc`7c05b5ba 4883ec50 sub rsp,50h
00007ffc`7c05b5cd 81413890010000 add     dword ptr [rcx+38h],190h
00007ffc`7c05b5db 8b4138 mov eax,dword ptr [rcx+38h]
00007ffc`7c05b5de 488bfa mov rdi,rdx
00007ffc`7c05b5e1 488bd9 mov rbx,rcx
00007ffc`7c05b600 3b01 cmp eax,dword ptr [rcx]
00007ffc`7c05b602 761e jbe filemgmt!CServiceControlProgress::M_OnTimer+0x6e (00007ffc`7c05b622)
00007ffc`7c05b604 488b5130 mov rdx,qword ptr [rcx+30h]
00007ffc`7c05b608 488bcf mov rcx,rdi
00007ffc`7c05b60b ff1597740200 call qword ptr [filemgmt!_imp_KillTimer (00007ffc`7c082aa8)]
00007ffc`7c05b611 4883633000 and qword ptr [rbx+30h],0
00007ffc`7c05b616 c783a00600001d040000 mov dword ptr [rbx+6A0h],41Dh

The first parameter of the function, the this pointer (of CServiceControlProgress) that is passed at the rcx register (x64 calling convention) has some interesting fields:

0:000> dps rcx
00000000`03a17b80 00000005`0001e848
00000000`03a17b88 00000000`002b063a
00000000`03a17b90 00000000`00500e0e
00000000`03a17b98 00000000`003c0e96
00000000`03a17ba0 00000000`02440d9e
00000000`03a17ba8 00000000`00000000
00000000`03a17bb0 00000000`00000001
00000000`03a17bb8 00000000`00000960

We can see in the code that the [rcx+38] offset is incremented by 0x190 and then compared to [rcx] (both values are highlighted in the memory dump above). When [rcx+38] is bigger than [rcx], KillTimer is called and [rbx+0x6A0], which is equal to the [rcx+0x6A0] of the start of the function (reminder: rcx was the this pointer), gets assigned the value of decimal 1053 (0x41D), which is our displayed error code, and if we disassemble CServiceControlProgress::M_ProcessErrorCode we would see that it reads the same pointer and passes the value to the message box with the description of this error code, which pretty much confirms that perpetrator is the progress bar dialog and that we shouldn’t worry about the error message box, as the actual interaction with the service happens on another thread, and is not affected by this, below was the call stack during all of this:

0:000> ~9k
Child-SP RetAddr Call Site
00000000`04cef0d8 00007ffc`9b5e1199 ntdll!NtAlpcSendWaitReceivePort+0xa
00000000`04cef0e0 00007ffc`9b5d3f2d RPCRT4!LRPC_CCALL::SendReceive+0x169
00000000`04cef1a0 00007ffc`9b5dea0f RPCRT4!I_RpcSendReceive+0x59
00000000`04cef1d0 00007ffc`9b6df750 RPCRT4!NdrSendReceive+0x2b
00000000`04cef200 00007ffc`9b6dfc1c RPCRT4!NdrpClientCall2+0x363
00000000`04cef820 00007ffc`9aeb62a3 RPCRT4!NdrClientCall2+0x1c
00000000`04cef850 00007ffc`7c05be40 sechost!StartServiceW+0x23
00000000`04cef8a0 00007ffc`9b2713d2 filemgmt!CServiceControlProgress::S_ThreadProcStartService+0x80

00000000`04cef8d0 00007ffc`9d525444 KERNEL32!BaseThreadInitThunk+0x22
00000000`04cef900 00000000`00000000 ntdll!RtlUserThreadStart+0x34


Trivia and a sanity check: if we set a breakpoint at the user32!SetTimer and get the interval parameter that was passed by our dialog, we would see that it’s 0x190, which equals to the increment at the timer handler function we saw, meaning that the values we saw are in time units and that the stop condition which is 0x1e848, or 125000 in decimal, is 125 seconds, pretty close to the 2 minutes that we observed.

Posted in: , by . No comments

Diagnosing which process is consuming commit charge with pagefile-backed sections


introduction

Most of the time when there is memory pressure on the system it’s easy to find the offending process by simply checking the Task Manager. However, there is one kind of memory usage that can consume Commit Charge but won’t show up on any Task Manager (including Process Explorer, Process Hacker and even opening the correct process with VMMap), it is Pagefile-Backed Sections.

Pagefile-backed sections

Sections are the underlying objects of Memory-Mapped Files and pagefile-backed sections mean that the backing store behind the memory is the Pagefile, and thus they consume Commit Charge. It makes sense to use those objects when you want to store temporary data that you don’t want constantly in memory (by creating the sections, filling them with data and then unmapping them from the process address space, that’s why VMMap doesn’t help here as well – if the sections are unmapped), an advantage of this method over simple file I/O is that you don’t leave unneeded files in case the process or the system crashes.

An example of extensive pagefile-backed sections usage is Process Monitor, that tool can capture a very large amount (many millions) of system events without pressuring physical memory using pagefile-backed sections as the event store. I once forgot that I left it open and ran out of Commit Charge and got the “your computer is low on memory. close programs to prevent information loss” error. Process Explorer couldn’t help finding the guilty process and that’s how this post was born.

Looking for pagefile-backed sections

In this great post (suggested reading for more details about Windows virtual memory management), Sysinternals’ handle.exe with the –l flag is suggested to display the size of the pagefile-backed sections that all processes has handles to, however currently that flag seems broken (crashes), so I’ll suggest alternative methods for tracking pagefile-backed sections.

Both Process Explorer and Process Hacker are capable of displaying the size of the pagefile-backed sections that a process has handles to, with this method you would have to go over suspect processes one by one.

Process explorer

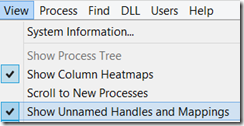
First we should check Show Unnamed Handles and Mappings:
image

Now in the handles pane we can see unnamed pagefile-backed sections and by double-clicking them we can see their size (in hex bytes):
 image

Process hacker

After choosing and double-clicking on a process, in the handles tab uncheck hide unnamed handles and similarly to Process Explorer you can view the section size:
image

Note that in both applications in this case you can see that the type of the section is “Reserve  which means that the memory specified is reserved and not necessarily committed (if nothing was committed there is zero impact on Commit Charge).

Checking the Committed memory

In order to see the committed memory by the sections we can do local kernel debugging with LiveKD.
We can take the address of the Section object from either application and dump its _SECTION_OBJECT structure:

0: kd> dt nt!_SECTION_OBJECT 0xFFFFC00065CB95C0
+0x000 StartingVa : 0xffffd000`2213d8e8 Void
+0x008 EndingVa : 0xfffff802`4e4a8f75 Void
+0x010 Parent : 0x00000000`00000001 Void
+0x018 LeftChild : (null)
+0x020 RightChild : (null)
+0x028 Segment : 0xffffc000`5c0f66b0 _SEGMENT_OBJECT

The Segment structure contains the committed memory size:

0: kd> dt nt!_SEGMENT 0xffffc000`5c0f66b0
+0x000 ControlArea : 0xffffe001`43f15880 _CONTROL_AREA
+0x008 TotalNumberOfPtes : 0x17d79
+0x00c SegmentFlags : _SEGMENT_FLAGS
+0x010 NumberOfCommittedPages : 0x9c00
+0x018 SizeOfSegment : 0x17d79000
+0x020 ExtendInfo : (null)
+0x020 BasedAddress : (null)
+0x028 SegmentLock : _EX_PUSH_LOCK
+0x030 u1 : <unnamed-tag>
+0x038 u2 : <unnamed-tag>
+0x040 PrototypePte : (null)

I Used _SEGMENT instead of _SEGMENT_OBJECT (that is contained in _SECTION_OBJECT’s symbols) because _SEGMENT_OBJECT’s output didn’t make sense (for example NonExtendedPtes can’t be the same size as the section in bytes, as a PTE is used for each page, which is 0x1000 bytes of memory): 


0: kd> dt nt!_SEGMENT_OBJECT 0xffffc000`5c0f66b0
+0x000 BaseAddress : 0xffffe001`43f15880 Void
+0x008 TotalNumberOfPtes : 0x17d79
+0x010 SizeOfSegment : _LARGE_INTEGER 0x9c00
+0x018 NonExtendedPtes : 0x17d79000
+0x01c ImageCommitment : 0
+0x020 ControlArea : (null)
+0x028 Subsection : (null)
+0x030 MmSectionFlags : 0xffffe001`45e7a8c0 _MMSECTION_FLAGS
+0x038 MmSubSectionFlags : 0x00000000`3fde0000 _MMSUBSECTION_FLAGS


So the committed memory is NumberOfCommittedPages * 0x1000 bytes, which in this case is 0x9c00000 bytes, or 156MBs.


other methods

Possible alternative methods that would not require checking each process are based on kernel debugger commands:

  1. !ca 0 21 or !ca 0 28 – that command displays all system control areas related to pagefile-backed sections, control areas are structures related to file mappings, and they are pointing to Segment structures that we’ve seen above. However the 0 parameter seems currently broken (checked both with LiveKD on Windows 8.1 and live debugging on Windows 10).

  2. !handle 0 1 Section – that command displays all handles in all processes pointing to section objects and it can be scripted to dump the size of the committed memory using the structures displayed above.

Posted in: , by . No comments

Debugging Assemblies that weren’t built with debug information


introduction

Using this great dotPeek feature we can debug any third party managed assembly we want (it gets even better when we prevent JIT optimizations), unless it was built without debug information. This can be seen during debug in the Modules window:image
Such assemblies were created without a PDB file using that setting:image
The debugger sees that the assembly was created without a PDB file, so it will refuse loading the “fake” PDB that dotPeek creates.

Note that there is no reason to build assemblies with this setting, the fact that the assembly points to a PDB file is mostly relevant during debug time and has no impact on performance. Thus it’s rare to find such assemblies (all Microsoft’s .NET Framework assemblies and even Windows’ native DLLs were built with PDBs for example) but they exist.

Where is that information stored?

This information is stored in the PE header, and can be viewed with dumbin /headers:

C:\> dumpbin /headers Test.dll
...
Debug Directories

Time Type Size RVA Pointer
-------- ------ -------- -------- --------
55324F94 cv 24 00125D90 123F90 Format: RSDS, {C2B3677B-EE83-4
1DA-8CA2-C16D74BB6C87}, 1, Test.pdb
...

The output above contains the GUID that is matched by the debugger in the loaded PDB file along with few other things. When Debug Info is set to none no Debug directories are emitted and thus no PDB file can be matched.


What can we do?

Theoretically it is possible to directly add Debug Directories to the assembly but no common tool does it, so we’ll use ildasm and ilasm:

C:\> ildasm NoDebugInfo.dll /out=Test.il
C:\> ilasm /dll /pdb /Out:Test.dll Test.il


Those pair of commands create an assembly with a PDB file, thus the assembly has Debug Directories that point to the PDB. You now may be asking the following:


  1. What if the assembly is strong name signed?
    This will break the signature, but for some cases it isn’t validated and when it is you can disable validation for this assembly using sn –Vr <AssemblyFile> (don’t forget to restore the setting later using sn –Vu or sn -Vx). Note that you must run the correct edition (32 bit or 64 bit) for the program you are running, the Visual Studio Developer Command Prompt on my machine references the 32 bit one so for 64 bit application I must run the one located in C:\Program Files (x86)\Microsoft SDKs\Windows\v8.1A\bin\NETFX 4.5.1 Tools\x64 on my machine.

  2. What does the created PDB contain?
    .NET PDBs point between IL offsets and source code lines, in this case instead of C# our source is IL, which isn’t really useful because the same IL instructions are embedded in the assembly, However for our purpose it doesn’t matter, we just wanted to add Debug Directories and we’ll use the dotPeek provided PDB that is “faking” the PDB signature to actually debug C# code.

Posted in: , , by . No comments

The Relationship between .NET and the Windows Kernel


Introduction

A question that one may ask is "Is the Windows kernel aware of the .Net Framework?".
Assuming "No" here is very sensible because the Windows kernel should expose all of the necessary services for any software framework in the Windows API, and any kernel changes made for a software framework would hurt encapsulation.
Indeed, the entire .NET CLR is made of DLL’s that are using the Windows API, However there are few features in .NET that involve kernel modifications and I will discuss them in this post.


How .NET executables launch

.NET executables (and .NET DLLs as well) are like other exe files on Windows, they use the Portable Executable (PE) file format, and are usually launched with a CreateProcess Windows API call.
When Windows launches a native process the last step of the process startup is passing the execution control to the entry point of the executable (can be viewed with dumpbin /headers command). With .NET executables, since Windows XP, the system passes the execution to _CorExeMain function of the mscoree.dll (ignoring the entry point), which initializes the CLR and passes the control to it (On older versions of Windows the system did pass execution to the executables’s entry point which contained short code to jump to _CorExeMain).

The component that runs at the start of the process, and is responsible for initialization tasks like calling _CorExeMain, is called the NTDLL Loader, you can note that its functions start with ntdll!Ldr*.

How does windows recognize .NET executables? They contain .NET specific metadata, the part that is relevant to this post can be viewed (and modified) with the CorFlags utility.
This is the first demonstration of Windows' knowledge of .NET, but the next features are bigger.


AnyCPU Executables

The interesting feature of .NET executables that run as 64-bit  on 64-bit Windows, and as 32-bit on 32-bit windows.

The newer Prefer 32-bit option isn’t very interesting for this post, as on 64-bit windows it makes the executable behave like a 32-bit only executable when launched, thus we will refer to AnyCPU as an executable built without this flag.

How does it work?

The documentation of mscoree’s _CorValidateImage refers to changing 32-bit (PE32) executable image to 64-bit (PE32+) executable image in memory (an executable in memory is called an Image) on 64-bit Windows, and you might think that it's all to it, However that's a user mode function that is supposed to be called in the newly created process by the NTDLL Loader, the decision about the architecture of a process happens earlier, and in kernel mode (kernel structures like EPROCESS depend on it), so there has to be some kernel mode code knowing about .NET which decides which architecture to use.

Note: I debugged and _CorValidateImage isn't getting called on Windows 8.1 (on Windows 7 it does), its responsibility seems to have moved to the Loader's LdrpCorValidateImage and LdrpCorFixupImage functions.

Entering kernel mode

I attached a kernel debugger to a Windows 10 VM, I wanted to inspect the data structures related to executables in memory.

I started with finding the process (I chose ILSpy, an AnyCPU executable):

0: kd> !process 0 1 ILSpy.exe

PROCESS ffffe0001e7e57c0
SessionId: 1 Cid: 533c Peb: 7ff5ffb86000 ParentCid: 1808
FreezeCount 1
DirBase: 23540f000 ObjectTable: ffffc00158aded80 HandleCount: <Data Not Accessible>
Image: ILSpy.exe
VadRoot ffffe0001d03dac0 Vads 12 Clone 0 Private 44. Modified 5. Locked 0.
DeviceMap 0000000000000000
Token ffffc0015c62c930
ElapsedTime 09:02:01.350
UserTime 00:00:00.000
KernelTime 00:00:00.000
QuotaPoolUsage[PagedPool] 17352
QuotaPoolUsage[NonPagedPool] 1408
Working Set Sizes (now,min,max) (161, 50, 345) (644KB, 200KB, 1380KB)
PeakWorkingSetSize 148
VirtualSize 3 Mb
PeakVirtualSize 3 Mb
PageFaultCount 199
MemoryPriority BACKGROUND
BasePriority 8
CommitCharge 70
DebugPort ffffe0000e433cf0
Job ffffe0001f724430

VAD's are structures that windows uses to track the virtual address space of a process, each process has a VAD root (highlighted in the output above) and it points to other VAD's (and so on) forming a tree structure that represents the virtual address space of a process. The !VAD debugger extenstion command helps analyze VAD's. By passing the VAD Root of the process, the command displays the virtual memory layout of the process:

0: kd> !vad ffffe0001d03dac0
VAD level start end commit
ffffe000127bd430 ( 3) b90 c15 1 Mapped Exe EXECUTE_WRITECOPY \path\ILSpy.exe
ffffe00012993010 ( 2) c20 c3f 32 Private READWRITE
ffffe0001e92e320 ( 3) c40 c4e 0 Mapped READONLY Pagefile-backed section
ffffe00018be7dc0 ( 1) c50 d4f 5 Private READWRITE
ffffe00019f154c0 ( 3) d50 d53 0 Mapped READONLY Pagefile-backed section
ffffe0001dc9a090 ( 2) d60 d60 0 Mapped READONLY Pagefile-backed section
ffffe00019057120 ( 3) d70 d71 2 Private READWRITE
ffffe0001d03dac0 ( 0) 7ffe0 7ffef -1 Private READONLY
ffffe0000f121ca0 ( 2) 7ff5ffb60 7ff5ffb82 0 Mapped READONLY Pagefile-backed section
ffffe0000db3a5a0 ( 1) 7ff5ffb86 7ff5ffb86 1 Private READWRITE
ffffe00019a990f0 ( 3) 7ff5ffb8e 7ff5ffb8f 2 Private READWRITE
ffffe00019c043d0 ( 2) 7ffb3c5e0 7ffb3c78b 17 Mapped Exe EXECUTE_WRITECOPY \Windows\System32\ntdll.dll

Total VADs: 12, average level: 3, maximum depth: 3

We can see above the VAD describing our executable image (highlighted), now when we pass it to the !VAD command with the extra parameter 1, we’ll get extra details about that specific image:

0: kd> !vad ffffe000127bd430 1

VAD @ ffffe000127bd430
Start VPN b90 End VPN c15 Control Area ffffe000196e5d80
FirstProtoPte ffffc00146cbfbd0 LastPte ffffc00146cbfff8 Commit Charge 1 (1.)
Secured.Flink 0 Blink 0 Banked/Extend 0
File Offset 0
ImageMap ViewShare EXECUTE_WRITECOPY

ControlArea @ ffffe000196e5d80
Segment ffffc001584de880 Flink ffffe000127bd490 Blink ffffe000126fe150
Section Ref 2 Pfn Ref 83 Mapped Views 2
User Ref 4 WaitForDel 0 Flush Count 5ed8
File Object ffffe0000f1f3c80 ModWriteCount 0 System Views ffff
WritableRefs 0
Flags (a0) Image File

\path\ILSpy.exe

Segment @ ffffc001584de880
ControlArea ffffe000196e5d80 BasedAddress 0000000000400000
Total Ptes 86
Segment Size 86000 Committed 0
Image Commit 0 Image Info ffffc001584de8c8
ProtoPtes ffffc00146cbfbd0
Flags (1c20000) ProtectionMask

The output contains a property named Image Info (highlighted), that seems to contain the address of some kind of a structure (addresses starting with ffff are kernel space). Now the goal is to figure out which one, unfortunately the debug symbols of the object containing it - _SEGMENT, give no info about its type:

0: kd> dt nt!_SEGMENT ffffc001584de880
+0x000 ControlArea : 0xffffe000`196e5d80 _CONTROL_AREA
+0x008 TotalNumberOfPtes : 0x86
+0x00c SegmentFlags : _SEGMENT_FLAGS
+0x010 NumberOfCommittedPages : 0
+0x018 SizeOfSegment : 0x86000
+0x020 ExtendInfo : 0x00000000`00400000 _MMEXTEND_INFO
+0x020 BasedAddress : 0x00000000`00400000 Void
+0x028 SegmentLock : _EX_PUSH_LOCK
+0x030 u1 : <unnamed-tag>
+0x038 u2 : <unnamed-tag>
+0x040 PrototypePte : 0xffffc001`46cbfbd0 _MMPTE
0: kd> dps ffffc001584de880
ffffc001`584de880 ffffe000`196e5d80
ffffc001`584de888 01c20000`00000086
ffffc001`584de890 00000000`00000000
ffffc001`584de898 00000000`00086000
ffffc001`584de8a0 00000000`00400000
ffffc001`584de8a8 00000000`00000000
ffffc001`584de8b0 00000000`00000000
ffffc001`584de8b8 ffffc001`584de8c8
ffffc001`584de8c0 ffffc001`46cbfbd0

The above commands show the missing symbol information (first command) and the actual raw memory (second command) containing our pointer at the same offset (0x38).

The next option is guessing the type by searching for existing symbols:

0: kd> dt nt!*image*info*
ntkrnlmp!_MI_SECTION_IMAGE_INFORMATION
ntkrnlmp!_SECTION_IMAGE_INFORMATION
ntkrnlmp!_MI_EXTRA_IMAGE_INFORMATION

Trying dt with _SECTION_IMAGE_INFORMATION, and bingo, it fits (data like stack sizes makes sense):

0: kd> dt nt!_SECTION_IMAGE_INFORMATION ffffc001584de8c8
+0x000 TransferAddress : 0x00000000`004734be Void
+0x008 ZeroBits : 0
+0x010 MaximumStackSize : 0x100000
+0x018 CommittedStackSize : 0x1000
+0x020 SubSystemType : 2
+0x024 SubSystemMinorVersion : 0
+0x026 SubSystemMajorVersion : 4
+0x024 SubSystemVersion : 0x40000
+0x028 GpValue : 0
+0x02c ImageCharacteristics : 0x102
+0x02e DllCharacteristics : 0x8540
+0x030 Machine : 0x14c
+0x032 ImageContainsCode : 0x1 ''
+0x033 ImageFlags : 0x3 ''
+0x033 ComPlusNativeReady : 0y1
+0x033 ComPlusILOnly : 0y1

+0x033 ImageDynamicallyRelocated : 0y0
+0x033 ImageMappedFlat : 0y0
+0x033 BaseBelow4gb : 0y0
+0x033 Reserved : 0y000
+0x034 LoaderFlags : 1
+0x038 ImageFileSize : 0x83000
+0x03c CheckSum : 0x8859c

Immediatly it looks like it contains 2 interesting flags: ComPlusILOnly and ComPlusNativeReady.
ComPlusILOnly seems helpful, and it actually is: it simply tells us if the PE contains only IL instructions (CorFlags ILONLY flag) or it's a mixed mode (or native) executable. Obviously an executable that contains any amount of machine code (mixed or native) can't be AnyCPU, thus this flag must be set for it to work.

I couldn't really make sense of the name of ComPlusNativeReady flag but from testing it with different executables it is turned on (value is 1) when the executable is AnyCPU, the relevant CorFlags flags for that - 32BITREQ (only 32-bit) and 32BITPREF (prefer 32-bit) should be turned off, and the ILONLY flag must be turned on.

By changing these value in the debugger with eb <ImageFlagsAddres> <0,1,2,3> I observed how new processes of the same executable spawn differently (it worked because the PE headers aren't parsed each time a new process is launched, they are cached).

As for the kernel execution flow, the parsing of the executable seem to happen at the nt!MiParseImageSectionHeaders and nt!MiParseComImage functions, and the branching based on the Image Flags at nt!PspAllocateProcess and nt!PspDetectComplusILImage (checked using memory access breakpoints and some tracing).

Repositioning the image in memory


For increased security, since Windows Vista, a feature called ASLR is repositioning images in memory between boots, the reason that it happens only between boots and not for every process launch is because images should be shared between processes for best performance (think of images like ntdll.dll that every process contains and the memory that would have been wasted if they weren’t shared), and because of the fact that they contain pointers to absolute addresses, those addresses should be the same for every process. Thus all images are relocated only once per boot and otherwise every image has its own constant base address for all processes.

However, IL Only images contain no native code and thus no pointers to absolute addresses, so unlike native images there is no reason not to relocate them per process without compromising the sharing, and it actually is implemented in the kernel. Based on the ComPlusILOnly flag, the kernel decides whether to relocate the image every time the image is loaded to a process.
Below is a screen capture of Process Explorer’s DLL’s view of two processes of the same executable, note how the Base value changes. Similar relocations happen with managed IL only referenced DLL’s, unlike the Base of ntdll which stays the same.
  image


Conclusion


In this post we have seen how few features in .NET required Windows kernel modifications and inspected their high level implementation with some debugging techniques, This list of features wasn’t meant to be exhaustive but those are the features that I’m currently aware of, I’ll be happy to find more such features in the feature.

Posted in: , , by . No comments

Skipping over the last statement Of a function of an optimized Assembly in the visual studio debugger

Let’s imagine that we are debugging a third party module (possibly using this cool dotPeek feature), and want to skip the last line of the executing function. While it’s well known that it’s possible to skip over lines of code in the debugger, and it’s easily done in an unoptimized assembly by simply setting the closing curly bracket “}” as the next statement. That method doesn't work with an optimized build because because the compiler doesn’t emit IL NOP instruction at the end of the function whose debugging information can be pointing to the closing curly bracket (that’s how it works with an unoptimized build).

JIT optimization

Before we can set the next instruction to any instruction, we need to prevent JIT optimization
When an assembly is compiled with optimizations it also usually means that it’s going to be JIT optimized as well, which would make the debugging experience really bad with messages like “Cannot evaluate expression because the code of the current method is optimized” and also prevent changing the next instruction.

Preventing JIT optimization

The information on reliably preventing JIT optimization exists on the internet but it’s scattered across a few sources so It took me a while to find it. I’ll sum it up here:

  1. In case where a native image of the assembly is installed on the machine (as most framework assemblies like mscorlib.dll and System.dll are) the optimized native image would be loaded by default and we can prevent that by setting the environment variable COMPLUS_ZapDisable to 1.
  2. For each assembly that we want to prevent JIT optimization we should create an .ini file with the same name as the dll containing:
    [.NET Framework Debugging Control]
    GenerateTrackingInfo=1
    AllowOptimize=0

    note that the .ini file should be placed at the same directory as the assembly that it refers to loaded from (including the GAC and Temporary ASP.Net Files if needed).

The final result can be verified by seeing the assembly not optimized in the modules window during debug:
image

Skipping the last statement of a function

Let’s assume that our function is the following (now it would be obvious why I wanted to skip the last line).

private static void FailFast(string message, string detailMessage)
{
if (Invariant.IsDialogOverrideEnabled)
Debugger.Break();
Environment.FailFast(MS.Internal.WindowsBase.SR.Get("InvariantFailure"));
}

While preventing JIT Optimization allows us setting the next instruction, we still can’t skip the last source code line (because there is still no IL NOP that can be pointing to the closing curly bracket as it’s a C# compiler optimization)

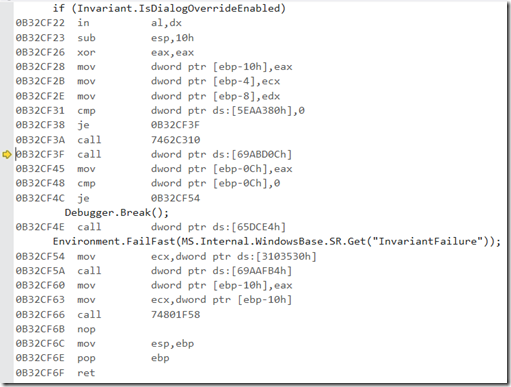
The trick is using the disassembly window to control the execution:
image 
The image contains the disassembly window when execution is broken at the first line of our function.

What we can do in this case is as with source code, set the next statement to be the beginning of the function epilogue (mov esp, ebp) thus skipping the instruction that causes the application to terminate (Environment.FailFast).

Obviously as with source code, we should be careful of where we directing the execution to prevent corruption (for example not skipping the function epilogue and corrupting the stack, supplying return value when needed). Also preventing the application from crashing when it wants to, like I did, is probably not a good idea but I wanted to check something quickly and it did the job.

Posted in: , , by . No comments