Showing posts with label Visual Studio. Show all posts

Debugging Assemblies that weren’t built with debug information


introduction

Using this great dotPeek feature we can debug any third party managed assembly we want (it gets even better when we prevent JIT optimizations), unless it was built without debug information. This can be seen during debug in the Modules window:image
Such assemblies were created without a PDB file using that setting:image
The debugger sees that the assembly was created without a PDB file, so it will refuse loading the “fake” PDB that dotPeek creates.

Note that there is no reason to build assemblies with this setting, the fact that the assembly points to a PDB file is mostly relevant during debug time and has no impact on performance. Thus it’s rare to find such assemblies (all Microsoft’s .NET Framework assemblies and even Windows’ native DLLs were built with PDBs for example) but they exist.

Where is that information stored?

This information is stored in the PE header, and can be viewed with dumbin /headers:

C:\> dumpbin /headers Test.dll
...
Debug Directories

Time Type Size RVA Pointer
-------- ------ -------- -------- --------
55324F94 cv 24 00125D90 123F90 Format: RSDS, {C2B3677B-EE83-4
1DA-8CA2-C16D74BB6C87}, 1, Test.pdb
...

The output above contains the GUID that is matched by the debugger in the loaded PDB file along with few other things. When Debug Info is set to none no Debug directories are emitted and thus no PDB file can be matched.


What can we do?

Theoretically it is possible to directly add Debug Directories to the assembly but no common tool does it, so we’ll use ildasm and ilasm:

C:\> ildasm NoDebugInfo.dll /out=Test.il
C:\> ilasm /dll /pdb /Out:Test.dll Test.il


Those pair of commands create an assembly with a PDB file, thus the assembly has Debug Directories that point to the PDB. You now may be asking the following:


  1. What if the assembly is strong name signed?
    This will break the signature, but for some cases it isn’t validated and when it is you can disable validation for this assembly using sn –Vr <AssemblyFile> (don’t forget to restore the setting later using sn –Vu or sn -Vx). Note that you must run the correct edition (32 bit or 64 bit) for the program you are running, the Visual Studio Developer Command Prompt on my machine references the 32 bit one so for 64 bit application I must run the one located in C:\Program Files (x86)\Microsoft SDKs\Windows\v8.1A\bin\NETFX 4.5.1 Tools\x64 on my machine.

  2. What does the created PDB contain?
    .NET PDBs point between IL offsets and source code lines, in this case instead of C# our source is IL, which isn’t really useful because the same IL instructions are embedded in the assembly, However for our purpose it doesn’t matter, we just wanted to add Debug Directories and we’ll use the dotPeek provided PDB that is “faking” the PDB signature to actually debug C# code.

Posted in: , , by . No comments

Skipping over the last statement Of a function of an optimized Assembly in the visual studio debugger

Let’s imagine that we are debugging a third party module (possibly using this cool dotPeek feature), and want to skip the last line of the executing function. While it’s well known that it’s possible to skip over lines of code in the debugger, and it’s easily done in an unoptimized assembly by simply setting the closing curly bracket “}” as the next statement. That method doesn't work with an optimized build because because the compiler doesn’t emit IL NOP instruction at the end of the function whose debugging information can be pointing to the closing curly bracket (that’s how it works with an unoptimized build).

JIT optimization

Before we can set the next instruction to any instruction, we need to prevent JIT optimization
When an assembly is compiled with optimizations it also usually means that it’s going to be JIT optimized as well, which would make the debugging experience really bad with messages like “Cannot evaluate expression because the code of the current method is optimized” and also prevent changing the next instruction.

Preventing JIT optimization

The information on reliably preventing JIT optimization exists on the internet but it’s scattered across a few sources so It took me a while to find it. I’ll sum it up here:

  1. In case where a native image of the assembly is installed on the machine (as most framework assemblies like mscorlib.dll and System.dll are) the optimized native image would be loaded by default and we can prevent that by setting the environment variable COMPLUS_ZapDisable to 1.
  2. For each assembly that we want to prevent JIT optimization we should create an .ini file with the same name as the dll containing:
    [.NET Framework Debugging Control]
    GenerateTrackingInfo=1
    AllowOptimize=0

    note that the .ini file should be placed at the same directory as the assembly that it refers to loaded from (including the GAC and Temporary ASP.Net Files if needed).

The final result can be verified by seeing the assembly not optimized in the modules window during debug:
image

Skipping the last statement of a function

Let’s assume that our function is the following (now it would be obvious why I wanted to skip the last line).

private static void FailFast(string message, string detailMessage)
{
if (Invariant.IsDialogOverrideEnabled)
Debugger.Break();
Environment.FailFast(MS.Internal.WindowsBase.SR.Get("InvariantFailure"));
}

While preventing JIT Optimization allows us setting the next instruction, we still can’t skip the last source code line (because there is still no IL NOP that can be pointing to the closing curly bracket as it’s a C# compiler optimization)

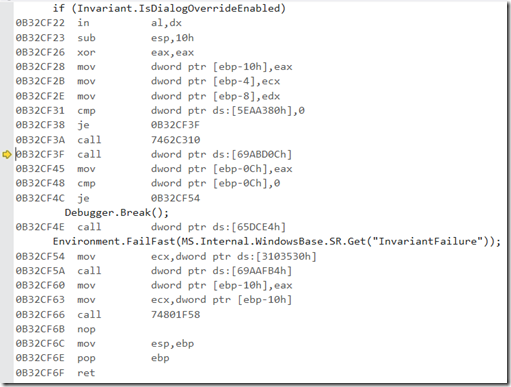
The trick is using the disassembly window to control the execution:
image 
The image contains the disassembly window when execution is broken at the first line of our function.

What we can do in this case is as with source code, set the next statement to be the beginning of the function epilogue (mov esp, ebp) thus skipping the instruction that causes the application to terminate (Environment.FailFast).

Obviously as with source code, we should be careful of where we directing the execution to prevent corruption (for example not skipping the function epilogue and corrupting the stack, supplying return value when needed). Also preventing the application from crashing when it wants to, like I did, is probably not a good idea but I wanted to check something quickly and it did the job.

Posted in: , , by . No comments