introduction
Most of the time when there is memory pressure on the system it’s easy to find the offending process by simply checking the Task Manager. However, there is one kind of memory usage that can consume Commit Charge but won’t show up on any Task Manager (including Process Explorer, Process Hacker and even opening the correct process with VMMap), it is Pagefile-Backed Sections.
Pagefile-backed sections
Sections are the underlying objects of Memory-Mapped Files and pagefile-backed sections mean that the backing store behind the memory is the Pagefile, and thus they consume Commit Charge. It makes sense to use those objects when you want to store temporary data that you don’t want constantly in memory (by creating the sections, filling them with data and then unmapping them from the process address space, that’s why VMMap doesn’t help here as well – if the sections are unmapped), an advantage of this method over simple file I/O is that you don’t leave unneeded files in case the process or the system crashes.
An example of extensive pagefile-backed sections usage is Process Monitor, that tool can capture a very large amount (many millions) of system events without pressuring physical memory using pagefile-backed sections as the event store. I once forgot that I left it open and ran out of Commit Charge and got the “your computer is low on memory. close programs to prevent information loss” error. Process Explorer couldn’t help finding the guilty process and that’s how this post was born.
Looking for pagefile-backed sections
In this great post (suggested reading for more details about Windows virtual memory management), Sysinternals’ handle.exe with the –l flag is suggested to display the size of the pagefile-backed sections that all processes has handles to, however currently that flag seems broken (crashes), so I’ll suggest alternative methods for tracking pagefile-backed sections.
Both Process Explorer and Process Hacker are capable of displaying the size of the pagefile-backed sections that a process has handles to, with this method you would have to go over suspect processes one by one.
Process explorer
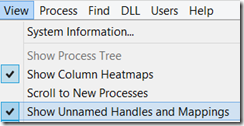
First we should check Show Unnamed Handles and Mappings:
Now in the handles pane we can see unnamed pagefile-backed sections and by double-clicking them we can see their size (in hex bytes):

Process hacker
After choosing and double-clicking on a process, in the handles tab uncheck hide unnamed handles and similarly to Process Explorer you can view the section size:
Note that in both applications in this case you can see that the type of the section is “Reserve” which means that the memory specified is reserved and not necessarily committed (if nothing was committed there is zero impact on Commit Charge).
Checking the Committed memory
In order to see the committed memory by the sections we can do local kernel debugging with LiveKD.
We can take the address of the Section object from either application and dump its _SECTION_OBJECT structure:
0: kd> dt nt!_SECTION_OBJECT 0xFFFFC00065CB95C0
   +0x000 StartingVa       : 0xffffd000`2213d8e8 Void
   +0x008 EndingVa         : 0xfffff802`4e4a8f75 Void
   +0x010 Parent           : 0x00000000`00000001 Void
   +0x018 LeftChild        : (null)
   +0x020 RightChild       : (null)
   +0x028 Segment          : 0xffffc000`5c0f66b0 _SEGMENT_OBJECT
The Segment structure contains the committed memory size:
0: kd> dt nt!_SEGMENT 0xffffc000`5c0f66b0
   +0x000 ControlArea      : 0xffffe001`43f15880 _CONTROL_AREA
   +0x008 TotalNumberOfPtes : 0x17d79
   +0x00c SegmentFlags     : _SEGMENT_FLAGS
   +0x010 NumberOfCommittedPages : 0x9c00
   +0x018 SizeOfSegment    : 0x17d79000
   +0x020 ExtendInfo       : (null)
   +0x020 BasedAddress     : (null)
   +0x028 SegmentLock      : _EX_PUSH_LOCK
   +0x030 u1               : <unnamed-tag>
   +0x038 u2               : <unnamed-tag>
   +0x040 PrototypePte     : (null)
I Used _SEGMENT instead of _SEGMENT_OBJECT (that is contained in _SECTION_OBJECT’s symbols) because _SEGMENT_OBJECT’s output didn’t make sense (for example NonExtendedPtes can’t be the same size as the section in bytes, as a PTE is used for each page, which is 0x1000 bytes of memory):
0: kd> dt nt!_SEGMENT_OBJECT 0xffffc000`5c0f66b0
   +0x000 BaseAddress      : 0xffffe001`43f15880 Void
   +0x008 TotalNumberOfPtes : 0x17d79
   +0x010 SizeOfSegment    : _LARGE_INTEGER 0x9c00
   +0x018 NonExtendedPtes  : 0x17d79000
   +0x01c ImageCommitment  : 0
   +0x020 ControlArea      : (null)
   +0x028 Subsection       : (null)
   +0x030 MmSectionFlags   : 0xffffe001`45e7a8c0 _MMSECTION_FLAGS
   +0x038 MmSubSectionFlags : 0x00000000`3fde0000 _MMSUBSECTION_FLAGS
So the committed memory is NumberOfCommittedPages * 0x1000 bytes, which in this case is 0x9c00000 bytes, or 156MBs.
other methods
Possible alternative methods that would not require checking each process are based on kernel debugger commands:
- !ca 0 21 or !ca 0 28 – that command displays all system control areas related to pagefile-backed sections, control areas are structures related to file mappings, and they are pointing to Segment structures that we’ve seen above. However the 0 parameter seems currently broken (checked both with LiveKD on Windows 8.1 and live debugging on Windows 10).
- !handle 0 1 Section – that command displays all handles in all processes pointing to section objects and it can be scripted to dump the size of the committed memory using the structures displayed above.


